

Reports & Artifacts
The Reports & Artifacts section of an IronSled project — Velocity, Runtime Vulnerabilities, Pipeline Vulnerabilities, Container SBOMs, Authorization Boundary, and Component Inventory reports, including PDF/CSV/JSON exports and which reports appear for code vs upload projects.
The Reports & Artifacts section of a project is where you generate and view reports about your project's development velocity, security posture, and software composition. Open it from the project sidebar (the Reports & Artifacts item). The landing page shows a grid of report cards; selecting a card opens that report in place, with a Back to Reports & Artifacts button to return to the grid.
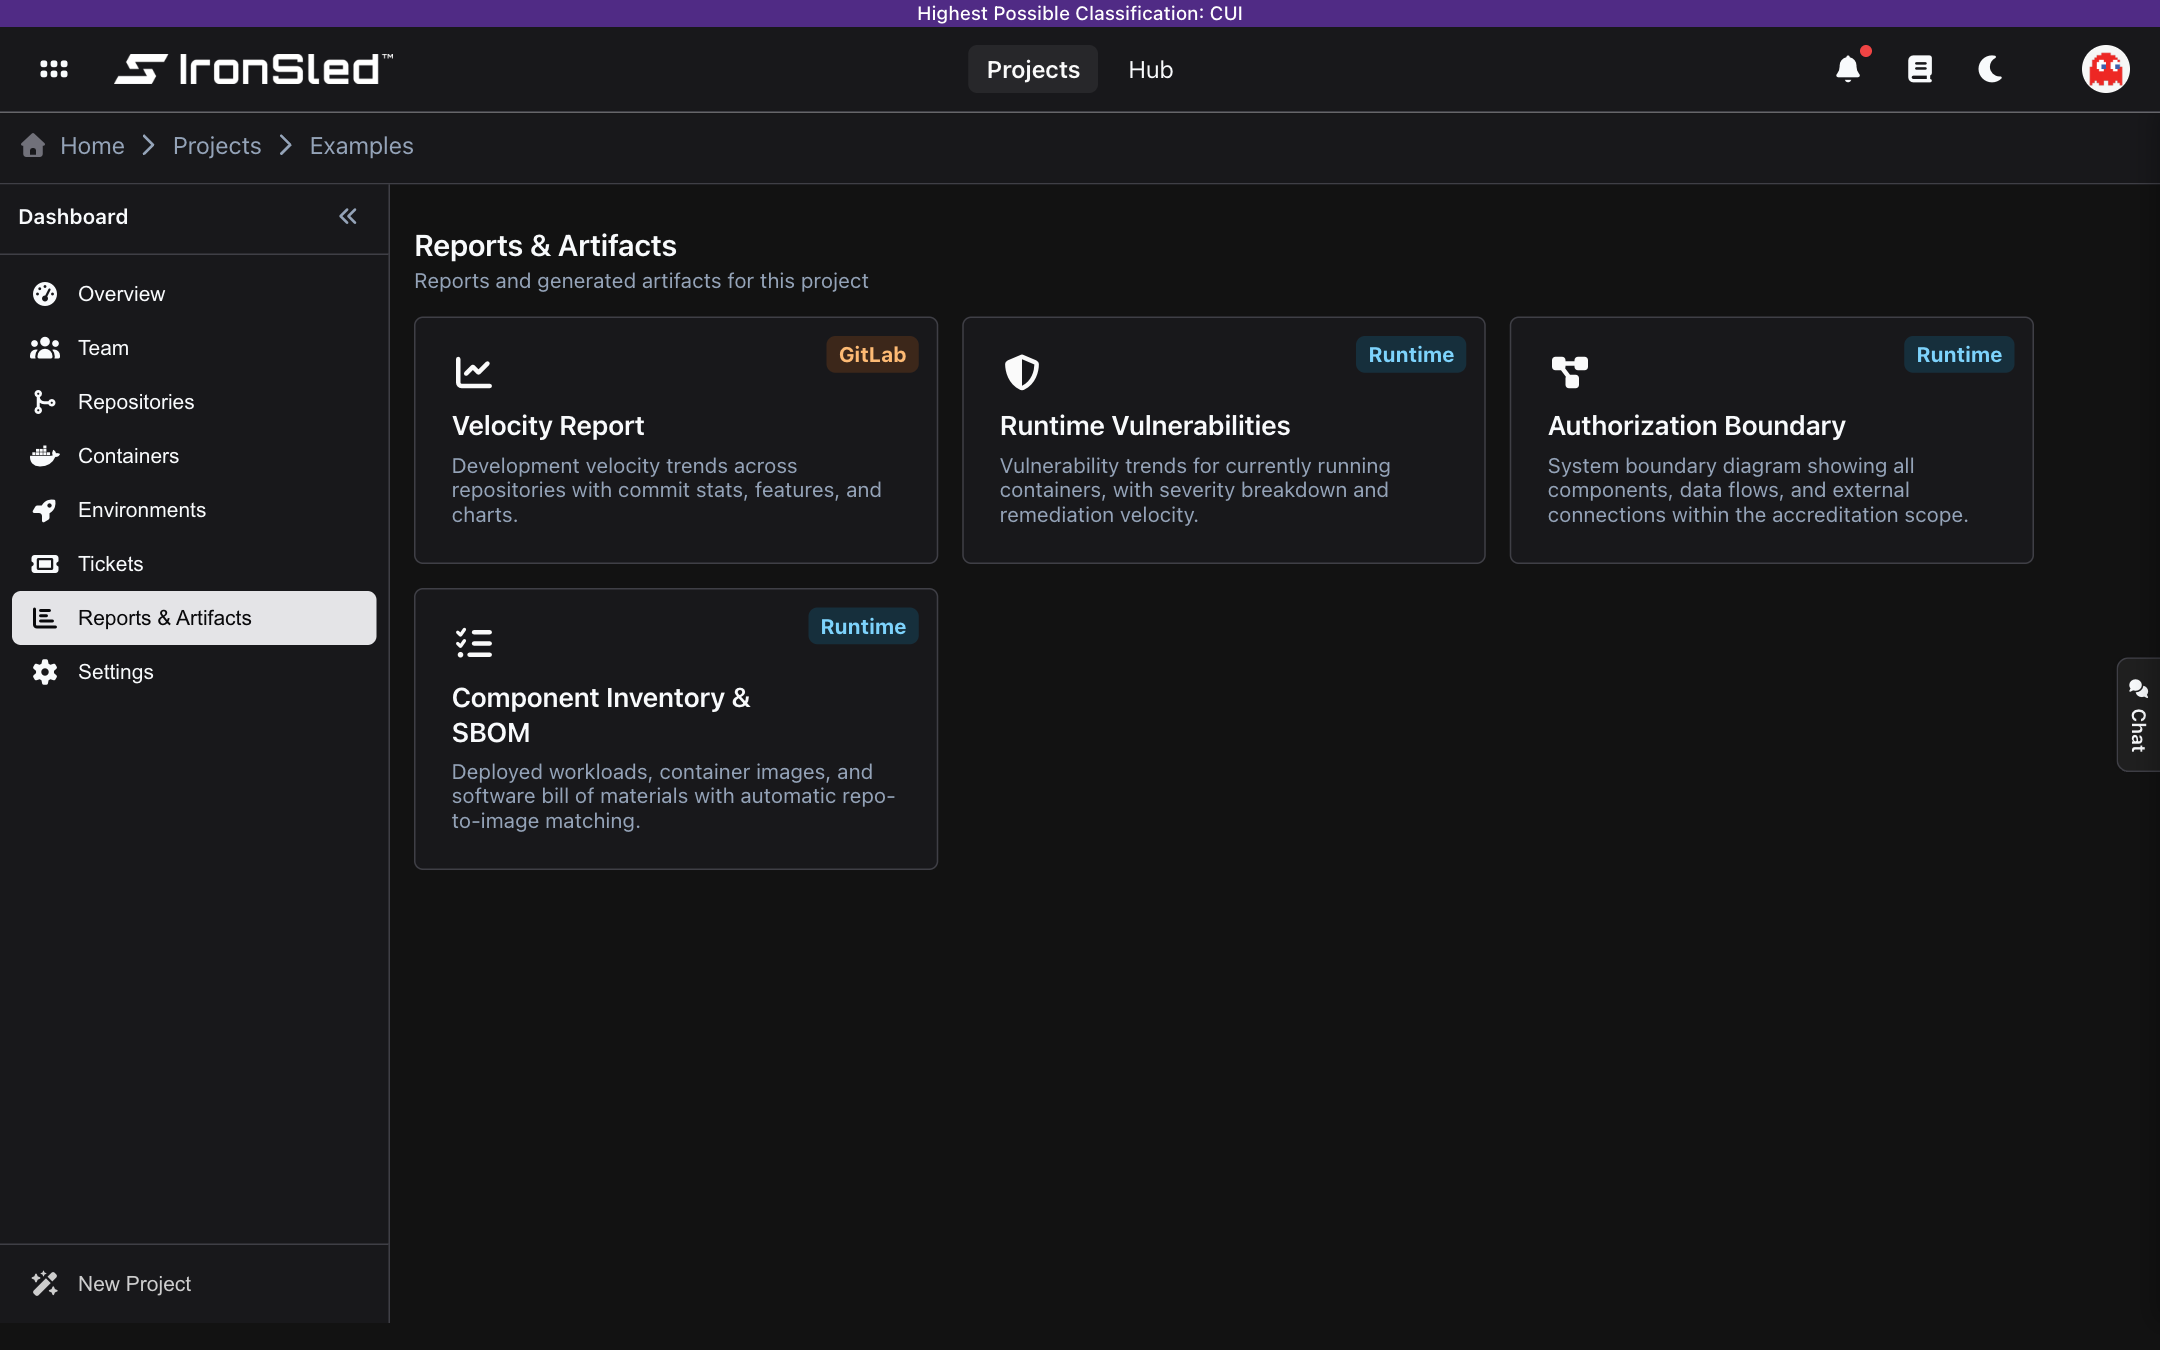
Each card carries a colored source badge showing where its data comes from:
- GitLab — built from your repositories' commit history.
- Pipeline — built from Trivy scan artifacts produced by your build pipelines.
- Runtime — built from what is actually deployed and running in your Kubernetes environments.
Which reports you see
Not every report appears for every project. Availability depends on the project type and whether the project has any environments linked:
| Report | Source | Appears for |
|---|---|---|
| Velocity Report | GitLab | Code / Build projects |
| Runtime Vulnerabilities | Runtime | Any project with at least one environment |
| Pipeline Vulnerabilities | Pipeline | Upload projects |
| Container SBOMs | Pipeline | Upload projects |
| Authorization Boundary | Runtime | All projects (requires an environment to generate) |
| Component Inventory & SBOM | Runtime | All projects (requires an environment to generate) |
Velocity Report
The Velocity Report shows development velocity trends across your repositories — commit statistics, feature delivery, and charts. It is available for Code / Build projects.
To generate it, configure:
- Repositories — a multi-select of the project's repositories, each with its own Branch dropdown (defaults to the repository's default branch, with an "all branches" option). Select All / Deselect All are available.
- Granularity — Day, Week, or Month (default Month).
- Date Range — a date picker that switches between a month range and a day range to match the granularity.
Select Generate Report (enabled once at least one repository is chosen). Generation runs asynchronously with a live status feed ("Report generation started…" through "Report complete!"). The finished report is rendered as a preview and includes:
- Headline statistic tiles.
- A Velocity Trend chart (commits per day, lines per day).
- A Totals table by period (business days, commits, commits/day, insertions, and deletions).
- A Per-Service Breakdown — Lines Added table.
- A Feature Delivery breakdown by period.
Routine commit "noise" (dependency bumps, Renovate, merge commits, and lint/clean chores) is filtered out so the numbers reflect meaningful work.
Export: select Print View to open the rendered report in a new tab and print it (use your browser's print-to-PDF). Generate New Report resets the form.
Runtime Vulnerabilities
The Runtime Vulnerabilities report shows vulnerability trends for the containers currently running in your environments, with a severity breakdown and remediation velocity. It appears only when the project has at least one environment.
Configure:
- Granularity — Day, Week, or Month (default Month).
- Date Range — the reporting window (defaults to roughly the last five months).
- Environment — a selector to scope the report to one environment, or All Environments.
Select Generate to render two charts:
- Active Vulnerabilities by Severity — a stacked area chart of active vulnerabilities over time, broken down into Critical, High, Medium, and Low.
- New vs Resolved — the number of vulnerabilities newly detected versus resolved in each period. When Resolved exceeds New, your backlog is shrinking.
The data comes from Trivy scans of your deployed workloads (the runtime findings surfaced in the Environments section), so it reflects what is live — not just what was scanned at build time. This report has no file export.
Pipeline Vulnerabilities
The Pipeline Vulnerabilities report aggregates all Trivy scan findings across your uploaded container images, taken from each image's build pipeline. It appears for Upload projects and loads immediately when opened.
At the top, a summary bar shows the total number of findings and how many containers are affected, with severity count tags: Critical, High, Medium, Low, and Unknown.
You can narrow the findings with:
- A search box (matches CVE ID, container, or package).
- A container multi-select.
- A severity multi-select.
- An Image versions control that lets you view a historical image tag per container. When a historical tag is selected, a "Historical" indicator and a banner explain that the findings reflect a past tag rather than the latest scan, with a Reset to latest action.
The findings table lists Severity, Vulnerability (CVE ID, linking to the source pipeline), Container (container:tag), Package, Installed version, Fixed version, and Justification. Findings are sorted most-severe first.
Justifications: for each finding you can add, edit, or delete a justification note (for example, "Accepted risk — not exploitable in our configuration"). Notes record their author and when they were created or edited.
If any upload pipelines are still running, a banner warns you and exports are disabled until the pipelines finish; a Refresh action re-checks. A separate warning lists any containers that do not yet have a readable scan report.
Export: PDF, JSON, and CSV. The PDF is a branded, landscape report of the currently filtered findings (it stamps the active filters and any historical tag selections into its summary). Exports are disabled while pipelines are still running.
Container SBOMs
The Container SBOMs report provides a CycloneDX software bill of materials for each uploaded container image. It appears for Upload projects. The table lists each Container, its Version, and an action to view or download the SBOM, with export to JSON and CSV.
Authorization Boundary
The Authorization Boundary report generates a per-environment system boundary diagram for ATO (Authority to Operate) documentation — showing the components, data flows, and external connections within the accreditation scope.
Because it describes what is actually deployed, it is a runtime report: select an Environment to generate the diagram. If the project has no environments yet, an info message explains that you must have the application running in Rancher with a mapped environment first (link environments in the Environments section). The generated diagram is saved as a compliance artifact for the project.
Component Inventory & SBOM
The Component Inventory & SBOM report is a per-environment inventory of the workloads, images, and software composition actually deployed. Select an Environment, then Generate Component Inventory (or Regenerate Inventory).
The result is a filterable, sortable table with columns for Name, Workload Type, State, Image, Replicas, Ports, Cluster, and SBOM. Expanding a row shows the component's SBOM inline. You can link a repository to a component so that images are matched to their source repository automatically.
Export: CSV and JSON. Like the Authorization Boundary, the generated inventory is saved as a compliance artifact.
Compliance artifacts
IronSled does not have a separate "Compliance" section. The two Runtime reports that support accreditation — the Authorization Boundary diagram and the Component Inventory & SBOM — are saved as compliance artifacts when you generate them, keyed to the project and environment. To produce or refresh these artifacts, generate the corresponding report from this section.
Request Infrastructure
Submitting tickets for new infrastructure resources — AI-assisted parsing, ticket lifecycle, platform team management, and activity tracking.
Settings
Managing project identity — name, cost center, description, light and dark mode logos, and the danger zone for decommissioning and permanently deleting a project.